- Published on
Leukocyte classification to predict diseases (Part 1)
- Authors
- Name
- Tan Ngoc Pham
- @ngctnnnn

Data analysis on number of blood cells, which are white blood cells and red blood cells, per a certain blood volume could help us observe our medical situation. In this blog, we introduce a faster method to recognize disease via the number of leukocytes.
Since this blog is rather long, we divide it into 2 parts, the first one is to introduce our approach to the problem, our dataset and our approach to preprocess data, then the second one is to discuss further about how to identify our needed cells in the preprocessed data through Canny object detection and Hough transformation.
Table of contents
1. Introduction
While blood cells (WBC), also known as leukocytes, are produced in the bone marrow and composed of nuclei and cytoplasm. WBCs are divided into five groups: basophil, eosinophil, lymphocyte, monocyte and neutrophil. Leukocytes protects the body against infectious disease and foreign substance, constitute an important part of the immune system. A healthy adult human consists of 4.1e9 to 11.1e9 of WBCs per a blood liter (or 4,500 to 11,000 WBCs per a blood microliter) and a drop in a blood consists of 7,000 to 25,000 WBCs. Any statistical number that outranges taken from an adult is considered as a disease.
Name | Description |
|---|---|
Neutrophils | Contact the microbial invasion, phagocytize and destroy invading organism |
Eosinophils | Part of defense mechanism against parasitic infections, inflammatory processes and allergic tissue reactions |
Basophils | Play role in allergic and immediate hypersensitivity reactions |
Monocytes | Involve in defensive reactions to some microorganisms, remove damaged cells, cell debris and armour bactericidal action as immune reaction |
Lymphocytes | Produce antibodies and join in immune reactions |
Table 1. Names and brief demonstration of normal leukocytes.
2. Dataset and data preprocessing
The LISC - Leukocyte Images for Segmentation and Classification is used for automatic identification and blood cells counting since it is relatively easy to use.
Samples were taken from peripheral blood of 8 normal subjects and 400 samples were obtained from 100 microscope slides. The microscope slides were smeared and stained by Gismo-Right technique and images were acquired by a light microscope (Microscope-Axioskope 40) from the stained peripheral blood using an achromatic lens with a magnification of 100. Then, these images were recorded by a digital camera and were saved in the BMP format. The images contain 720×576 pixels.
All of them are color images. The images were classified by a hematologist into normal leukocytes: basophil, eosinophil, lymphocyte, monocyte, and neutrophil. Also, the areas related to the nucleus and cytoplasm were manually segmented by an expert.
You can download dataset here: LISC database.
After that, images are transformed into gray scale using Python's opencv library:
import cv2
gray_img = cv2.cvtColor(original_img, cv2.COLOR_BGR2GRAY)
And after using opencv, we can change a normal leukocyte into a grayscale leukocyte.

3. Foreground and background segmentation technique
At the very first glance to the solution, we have to notice how to differentiate between foreground and background.
We could define foreground as an object that we want to observe detailedly. For a thorough understanding, a foregrounding object is the object we would like to separate from the whole picture for later purposes, e.g. object detecting or motion predicting. In this topic area, leukocytes and erythrocytes are defined as the foreground and moreover, we will not use background. Hence, at the end this section, we would guide you thoroughly to extract the foreground from the a whole picture.
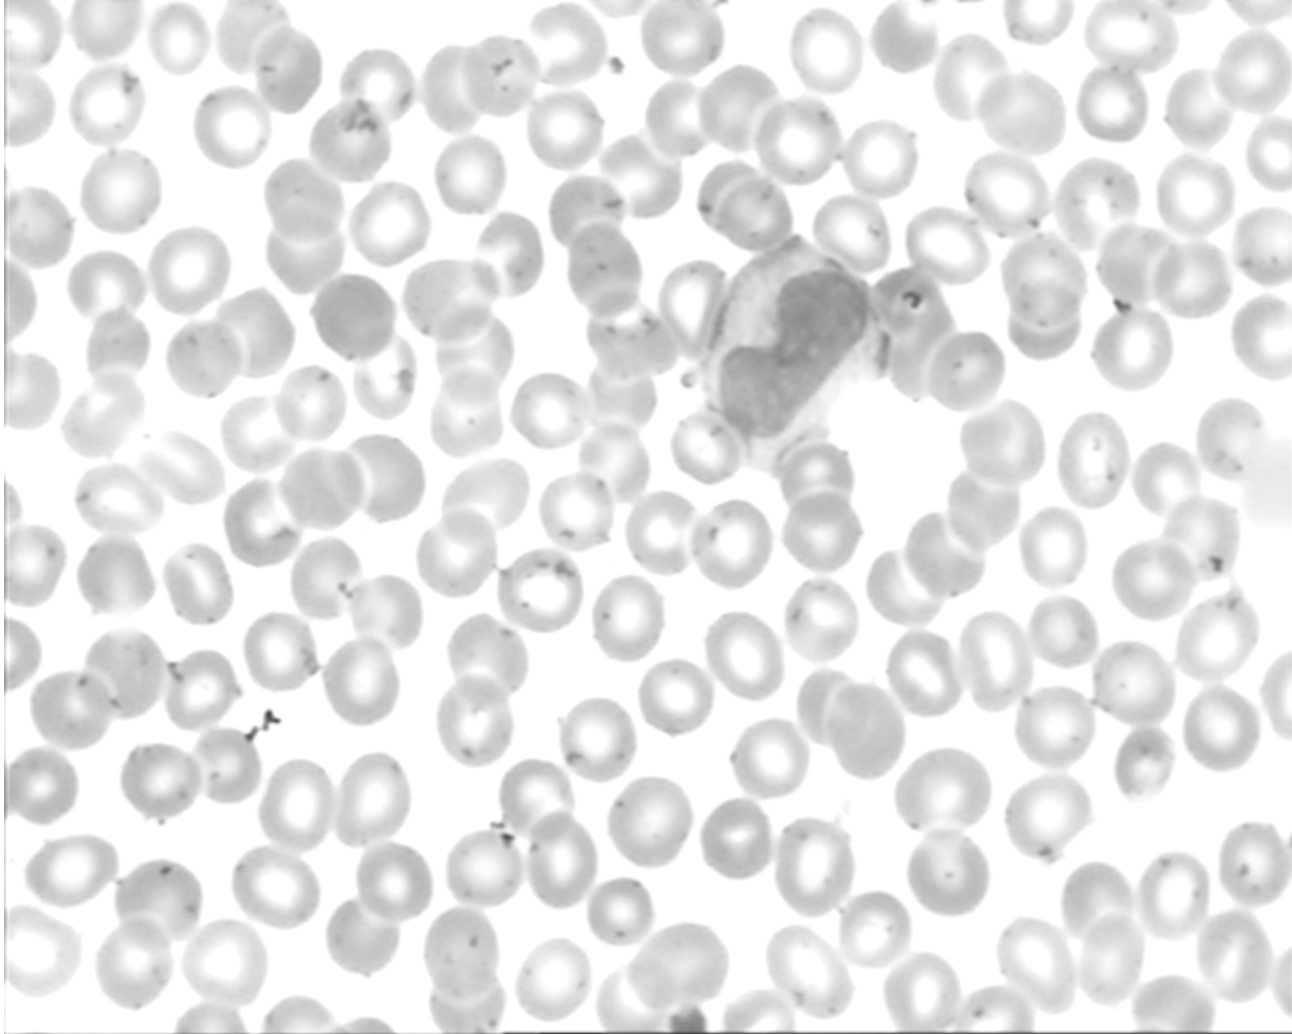
Let make an overview about the image mentioned below:

Scientific evidence has it that dark purple areas are leukocytes and light purple areas are erythrocytes. We would divide the whole picture into 2 different ones: the first one only consists of leukocytes' positions and the other consists of those from erythrocytes; and both of them would remain the original scale. The reason behind doing splitting thing is to make processing and classifying procedure more easily.
One of the most basic approach for this method is to use thresholding technique. The threshold formula could be expressed as below:
s.t. θ is defined as our threshold
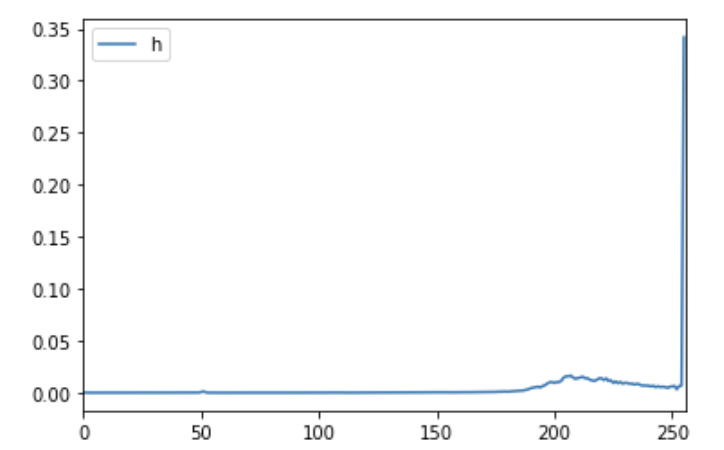
Since our image has been already transformed from RGB to gray-scale, all pixels are now in the threshold of from 0 to 255. We could get rid of background part by using histogram, which is the graph for representation of the distribution of colors in an image, to analyse and choose an appropriate threshold afterwards (i recommend you could take the chosen threshold from the number with the highest wave frequency).
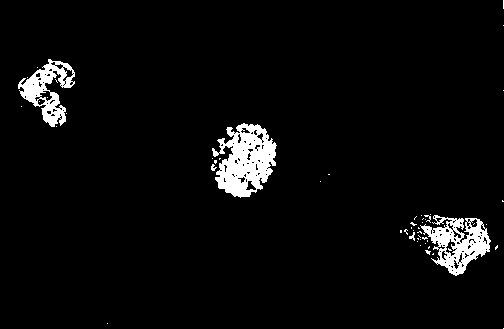
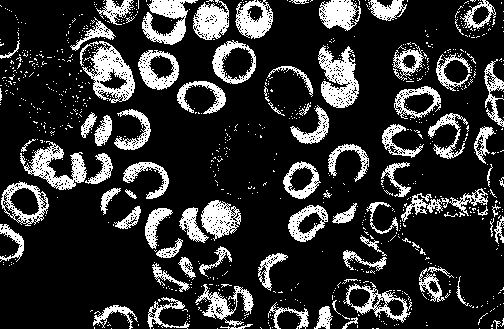
After that, the area with pixels valuing in f(x,y) > threshold are categorized as the foreground and vice versa is the background to identify the erythrocytes. In addition, we also apply another formula to extract leukocytes from the total image, which is:
After using our proposed method, we would achieve the result as followed:
Our next blog would discuss further about how to detect and count blood cells in preprocessed images.